
A pipeline velocity calculator turns four numbers you already track into the single metric that tells you how fast revenue moves through your system. Most founders running B2B companies know their win rate or average deal size in isolation. Few combine them into a formula that actually predicts cash flow 90 days out.
The formula is straightforward: (Number of Qualified Opportunities × Average Deal Size × Win Rate) ÷ Sales Cycle Length. The output is revenue per day. Change any one input and the entire trajectory shifts, which is what makes this useful for planning, not just reporting.
Use this pipeline velocity tool the way a sales velocity calculator should work: plug in your five numbers, read the daily-throughput output, then test which single lever, opportunities, deal size, win rate, or cycle length, moves it most.
The Sales Pipeline Velocity Formula: Five Inputs, One Output
Every pipeline velocity calculation depends on four variables that produce one actionable number. Here’s what each input means and where the data comes from.
Qualified Opportunities in Your Pipeline
This is the count of deals that have been confirmed as real and moving forward. Not names in your CRM. Not contacts who downloaded a PDF. Opportunities where discovery is complete and stakeholders are identified. Using inflated counts here is the fastest way to produce a number that lies to you.
Average Deal Size
Pull this from closed-won deals over the last 12 months, not from your price list. If your contracts range from $50K to $500K, the average might sit at $120K. Use the median if you have a few outliers skewing the mean. The goal is a number that reflects what deals actually close at, not what you wish they closed at.
Win Rate Based on Cohort Data
Win rate should come from a defined lookback period, typically 6 to 12 months of closed opportunities. Divide closed-won deals by total opportunities that reached the same qualified stage during that window. A common mistake is calculating win rate from all deals ever created, which dilutes the number with stale records that were never real.
For B2B companies selling complex solutions with sales cycles running 130 days or longer, win rates between 20% and 35% are typical. Anything above 40% usually means you’re not qualifying enough into the pipeline, not that your sales process is exceptional.
Sales Cycle Length in Days
Measure from the date an opportunity reaches qualified status to close date. Use the average across your closed-won deals from the same lookback period as your win rate. Mixing timeframes between inputs produces misleading velocity numbers.
The calculator is the easy part; knowing which lever to pull is the value. In industrial deals, cycle length is often the worst offender, because deals stall in the timing gap between a buyer’s current project and the next. So the highest-leverage move is often a re-engagement system, not more top-of-funnel. The number tells you where to look; the system moves it.
Run your numbers
Five inputs. Two numbers that tell you whether revenue is speeding up or slowing down.
Fill in all five and your numbers appear here.
That yearly figure is a run rate, not a forecast. It assumes your pipeline keeps refilling at today's pace.
Velocity is your weighted pipeline divided by your cycle length. The top of the formula is the money you would expect to close from what is open right now. The bottom is how long it takes to get there.
Move each lever by the same amount
Opportunities, deal size, and win rate all sit on top of the formula, so a 10% gain in any of them is a 10% gain in velocity. Cycle length sits underneath it. Taking 10% off your cycle is worth slightly more than adding 10% anywhere else.
| Lever | Per day | Per year |
|---|
Now use numbers you could actually hit
Equal percentages make cycle length win every time. That is arithmetic, not advice. Set a move you could realistically make on each lever and the ranking rearranges to fit your business.
| Move | Per day | Per year |
|---|
Go deeper: find the leak
Where accounts stall
Where deals die is measurable. Enter your stage conversion rates and compare them to the starting bands we use with a company that does not yet have its own history.
These bands are a starting point, not a verdict. They hold until you have enough of your own closed deals to replace them. And because buying committees loop back rather than move in a straight line, treat the opportunity count above as a check on the number you entered up top, not a projection.
Where your pipeline comes from
The share that arrives on its own is the share you do not control. Watch that number fall over time and the system is working.
One number this calculator cannot give you: how many people inside each account are actually engaged. In a buying committee of six to ten, a single interested contact is not a deal. Depth of engagement across the committee moves months before win rate or deal size does, and it is the leading indicator most vendors never track.
Want these numbers in your inbox?
We send your results. Your numbers stay yours and nothing else happens unless you ask.
You have the number. The harder question is which lever to pull.
Working out where velocity is leaking takes an afternoon. Building the go-to-market work that moves it is a different job, and it is the one we do for companies selling into manufacturing and distribution.
Book a GTM strategy sessionThis is an illustration. Run your own numbers in the calculator above.
Pipeline Velocity Calculator: A Worked Example
Say you’re an ERP consultancy with 15 qualified opportunities, an average deal size of $140K, a 25% win rate, and a 160-day sales cycle. The math: (15 × $140,000 × 0.25) ÷ 160 = $3,281 per day, or roughly $98K per month flowing through your pipeline.
Now change one lever. Shorten the sales cycle by 20 days through better stakeholder mapping and engaging the full buying committee earlier. The new number: (15 × $140,000 × 0.25) ÷ 140 = $3,750 per day. That single improvement adds $14K in monthly revenue throughput without closing a single additional deal.
This is why velocity matters more than any individual metric. Optimizing one variable compounds across the entire formula.

Pipeline Velocity vs. Coverage Ratio vs. Stage Conversion Rates
These three metrics work together, but they answer different questions. Confusing them leads to bad decisions.
| Metric | What It Answers | When It Matters Most |
|---|---|---|
| Pipeline Velocity | How fast is revenue moving through the system? | Forecasting and trend analysis |
| Coverage Ratio | Do we have enough pipeline to hit our target? | Quarterly planning and risk assessment |
| Stage Conversion Rates | Where are deals dying? | Diagnosing bottlenecks and fixing leaks |
Pipeline velocity tells you the speed of your revenue engine. Coverage ratio tells you whether you have enough fuel. Stage conversion rates tell you where the engine is losing power. You need all three, but velocity is the one that compounds when you improve any of the four underlying levers.
A healthy coverage ratio for companies with long sales cycles sits at 3x to 5x your revenue target. If you need $500K in new revenue this quarter and your win rate is 25%, you need $2M in qualified pipeline just to stay on track. Velocity tells you whether that pipeline is moving fast enough to convert in time.
When Velocity Is Low, Here’s How to Find the Broken Lever
A low velocity number is a symptom. The diagnosis depends on which input is dragging the formula down.
Too Few Qualified Opportunities
If your opportunity count is thin, the problem usually sits upstream. Either your account progression stages aren’t filling properly, or you’re depending on a single channel like referrals to generate all your pipeline. Companies that get most of their revenue from referrals hit this wall repeatedly. The fix isn’t more outbound volume. It’s building a demand creation system that moves target accounts from unaware to engaged before they ever talk to sales.
Win Rate Declining
Dropping win rates often mean you’re letting unqualified deals into the pipeline, or your competitive positioning has weakened. Review lost deals from the last two quarters. If prospects consistently chose a competitor or went with “do nothing,” the issue is likely messaging and differentiation, not sales execution.
Sales Cycle Stretching Longer
When cycles grow, it’s usually because deals stall in committee review. B2B buying groups involve 6 to 10 stakeholders. If you’re single-threaded into one contact, the deal stalls every time that person needs internal buy-in they can’t generate alone. Multi-threading across the buying group from the start is the most reliable way to compress cycle time.
Deal size is the one lever where “just increase it” sounds easy but carries risk. Pushing larger deals often means longer cycles and lower win rates. The net velocity impact can be negative. Focus on the other three levers first.
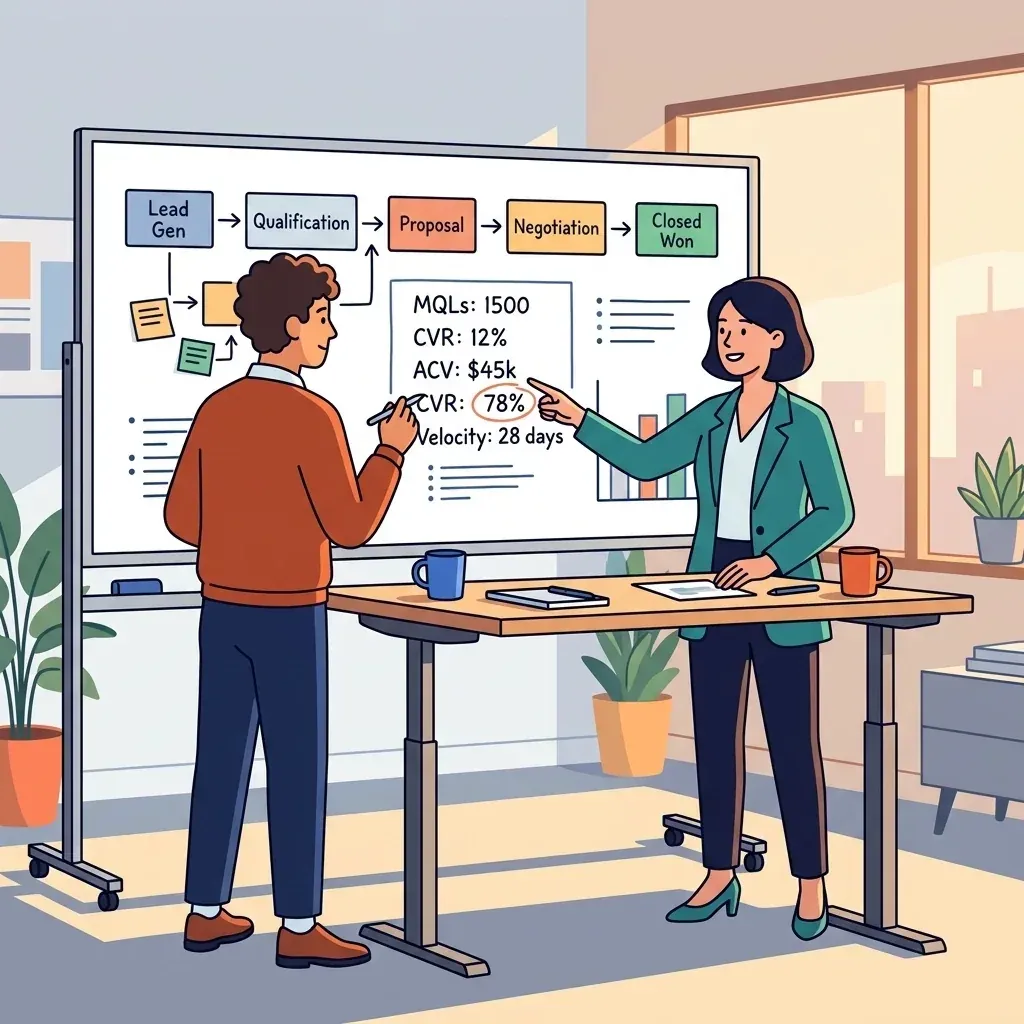
From Calculator to Revenue Model: Using Velocity for Forecasting
Once you have a baseline velocity number, the real value is scenario planning. What happens to quarterly revenue if you add five more qualified opportunities? What if you improve win rate by 5 percentage points through better sales and marketing alignment?
Run three scenarios: current state, conservative improvement (one lever improved 10%), and aggressive improvement (two levers improved 15% each). The gap between current and aggressive tells you your revenue ceiling. The gap between current and conservative tells you what’s realistic in the next 90 days.
This turns pipeline velocity from a reporting metric into a planning tool. You stop asking “what happened last quarter” and start asking “what needs to change this quarter to hit our number.”
Colony Spark builds these calculations directly into the revenue engines we operate for founder-led B2B companies. Pipeline velocity and stage conversion rates are two of the core metrics we track, alongside coverage ratio. Everything else is either a leading indicator of those numbers or noise. If you’re running an ERP consultancy, supply chain firm, or industrial technology company and your growth is bottlenecked by the founder carrying every sales conversation, these are the numbers that show you a path out.
Frequently Asked Questions
How often should I recalculate pipeline velocity, and who should own it?
Industrial vendor teams usually revisit it weekly for internal pacing and monthly for planning. Revenue operations or a sales operations owner typically maintains the inputs, while sales and marketing leaders review trends and agree on which lever to prioritize next.
How can I segment pipeline velocity for more accurate planning?
Break velocity into slices that behave differently, such as by product line, territory, or lead source. Segmenting reveals where the revenue engine is truly strong and prevents one high performing segment from masking weak areas.
What is the best way to handle multiple deal sizes or pricing tiers in the calculator?
Use a weighted approach by calculating velocity per segment or tier, then combining results based on expected mix. This avoids misleading averages when small and enterprise deals have very different win rates and cycle times.
How do I adapt pipeline velocity for subscriptions or recurring revenue models?
Replace deal size with the revenue figure you forecast on, such as annual recurring revenue (ARR) or first-year contract value, and keep the rest of the logic consistent. If expansions are a major growth driver, track a separate velocity for upsell and renewal opportunities.
What early warning signals suggest my velocity number is unreliable?
Large month-to-month swings without a clear operational change, or inconsistent definitions of qualification, are common red flags. If velocity improves only because fewer deals were counted or because older deals were removed, you likely have data hygiene issues rather than real performance gains.
How can I use pipeline velocity to set marketing targets without overpromising?
Translate the revenue goal into required qualified opportunities by backing into the inputs you can influence, then apply a buffer for variability. Align on definitions and acceptance criteria first, then track contribution by channel to understand which sources create qualified pipeline efficiently.
What changes should I avoid when trying to improve pipeline velocity?
Avoid pushing deals forward by skipping steps, discounting to force urgency, or redefining qualification to inflate counts. These tactics can temporarily lift a metric but often increase churn and create forecasting volatility in subsequent quarters.
Model Your Revenue Engine This Week
A pipeline velocity calculator isn’t a one-time exercise. Run it monthly. Track the trend. When velocity climbs, you’re building a compounding system. When it dips, you know exactly which lever to investigate. The founders who treat this as an operating metric rather than a quarterly report are the ones who build predictable revenue.
Want to see where your pipeline actually stands? Get a free Revenue Messaging Audit to find out how your positioning compares to competitors and where your revenue engine has room to accelerate.